ANERIS at EGI2026: Bringing Operational Marine Biology to Europe Digital Research Infrastructure Community

Between 21-25 September 2026, our team joined the EGI2026 conference in Ghent, Belgium.

Between the 21st and the 25th of September 2026, the ANERIS project, joined the EGI2026 Conference in Ghent, Belgium, as an exhibitor and conference partner.

Group photo EGI 2026
Group photo provided by EGI Foundation


Every year, the EGI Conference brings together digital and research infrastructure providers, data scientists and innovators to advance data-intensive science. Organised by the EGI Foundation in collaboration with partners from the EGI Federation, this year’s edition took place at the Bijloke, a former hospital site turned arts and knowledge campus on the banks of the river Lys. The five-day programme covered topics ranging from AI for European science and the European Open Science Cloud (EOSC) to federated compute and data infrastructures for research.

For ANERIS, the conference was a natural fit as the EGI Foundation is one of the project’s 25 partners, and the project’s vision of faster, more reliable and accessible marine life data depends directly on the kind of digital infrastructure discussed in Ghent.
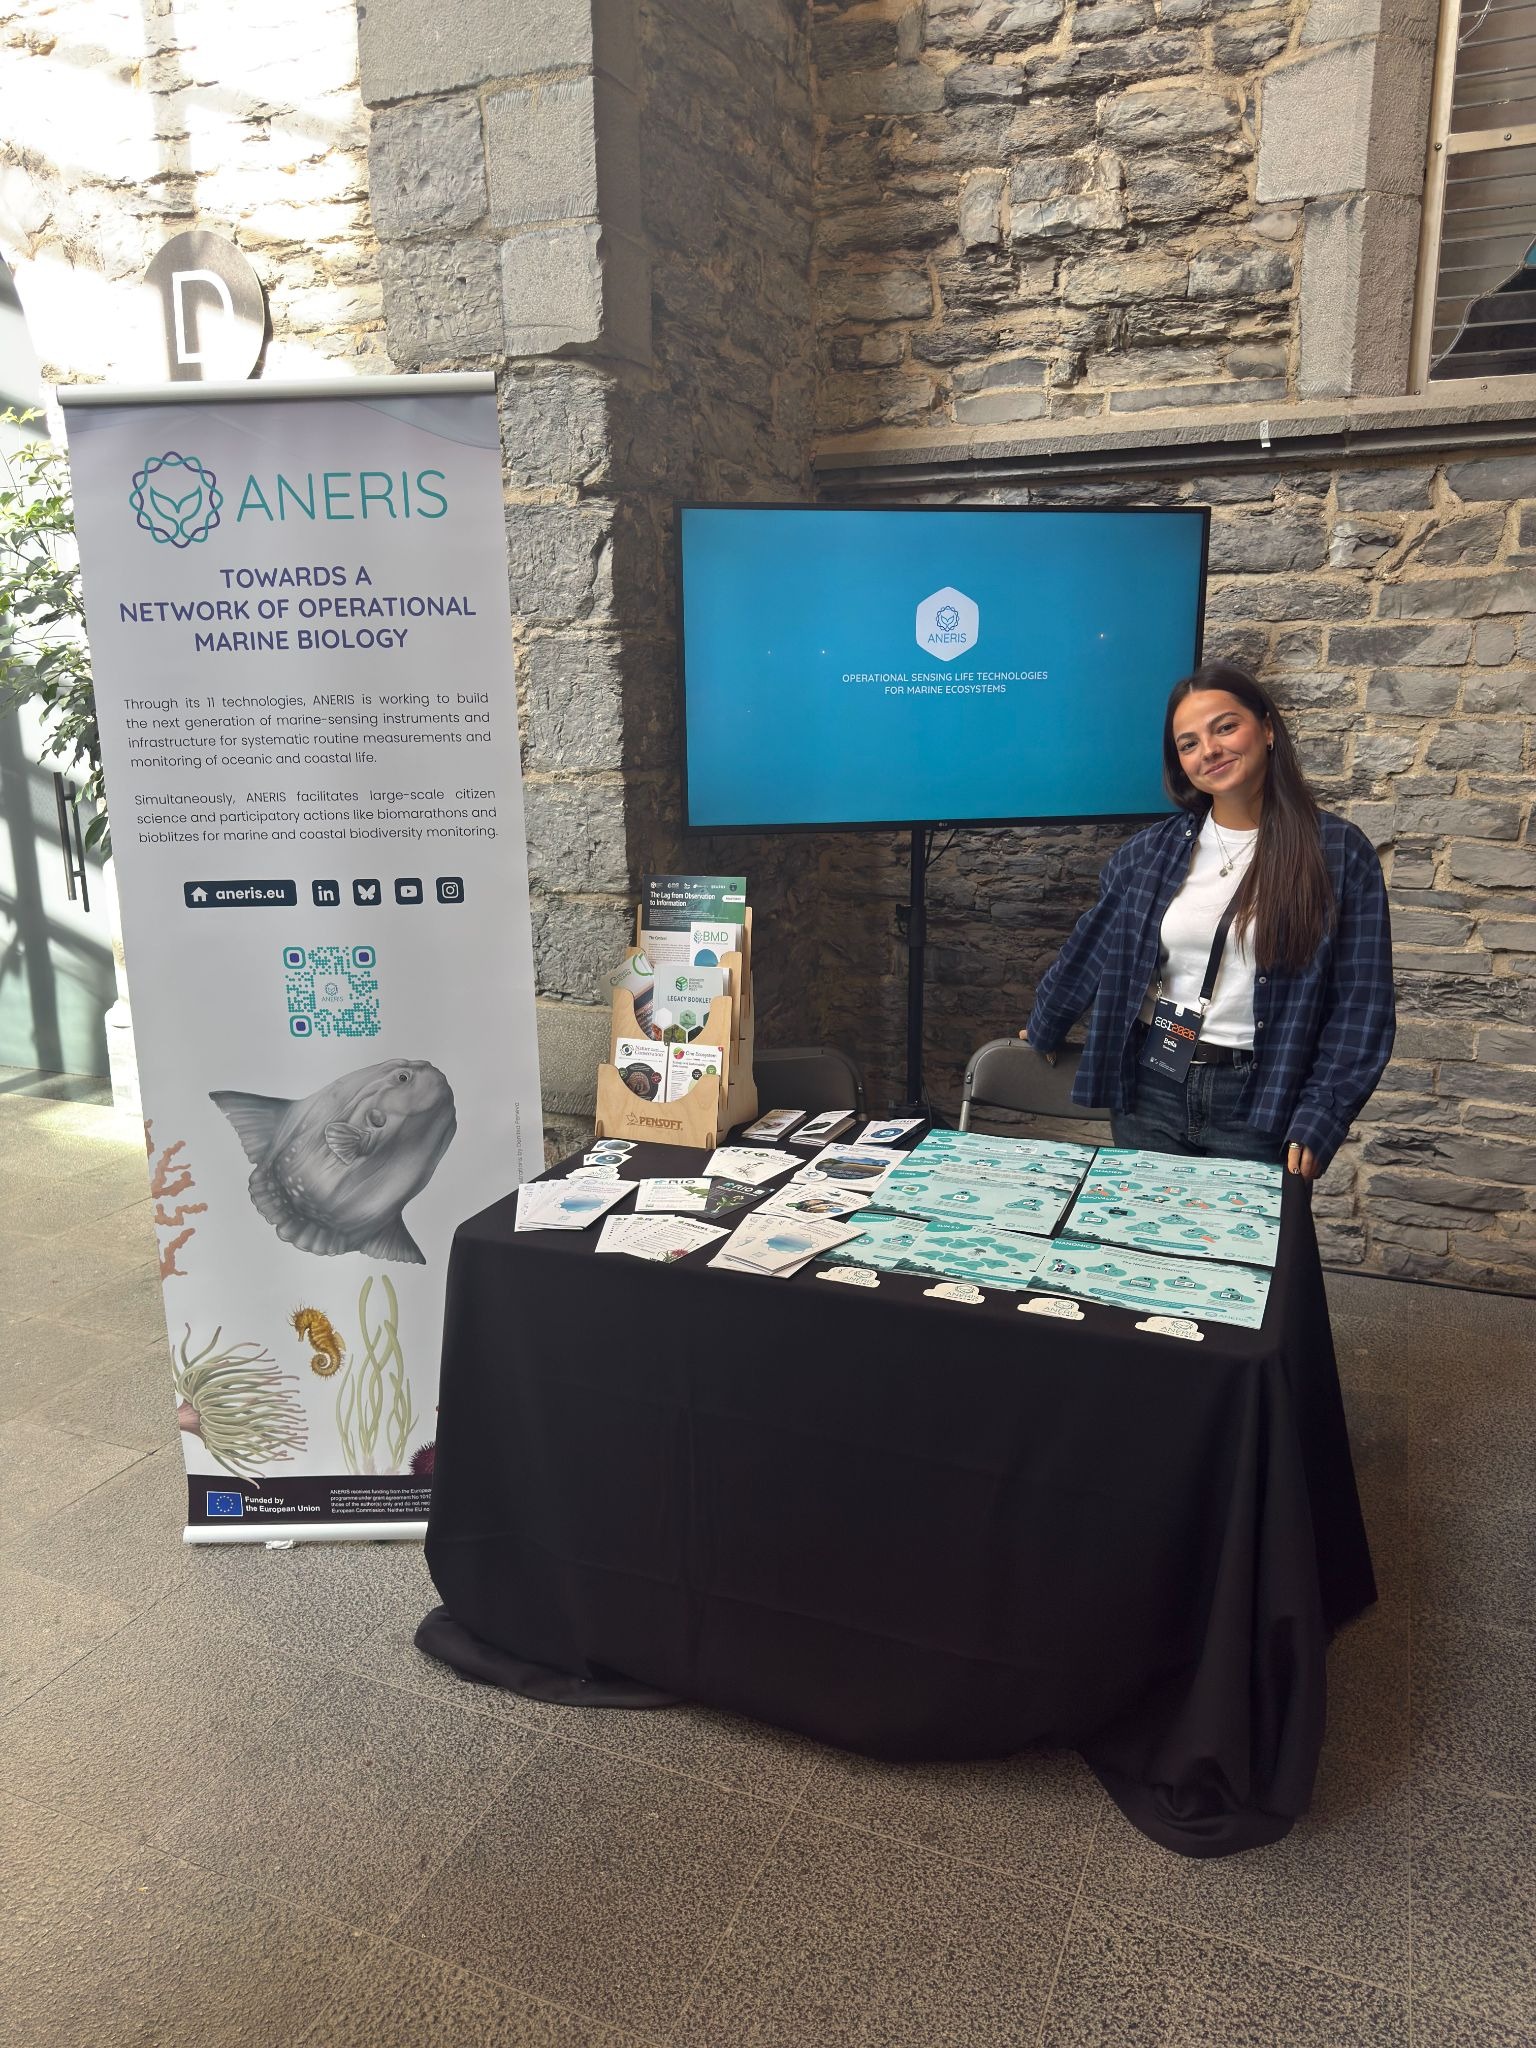
A person behind a stand
ANERIS booth at EGI2026 in Ghent.

During the opening ceremony, all exhibitors were invited to present their projects and initiatives to the audience in short pitches. Pensoft’s Communication Officer Bella Dimitrova used the opportunity to introduce ANERIS and its concept of Operational Marine Biology. Many attendees later came by the booth specifically to learn more about the project.

ANERIS materials
ANERIS materials.

The ANERIS booth welcomed a steady stream of visitors. Although most participants came from engineering and computing backgrounds, the project’s scientific illustrations and sticker sheets quickly became a highlight of the exhibition. The marine species featured on the stickers are among the most frequently observed and photographed during ANERIS citizen science campaigns. This made them a natural starting point for conversations about how volunteers, researchers and new technologies work together to monitor coastal biodiversity. Visitors also showed strong interest in the project’s newly produced case study factsheets and infographics, which made their print debut at the conference.

  • paper materials
  • paper materials
  • paper materials

At the booth, attendees could also learn more about Pensoft’s expertise and experience as a scientific publisher through a selection of journals aligned with the conference themes. They could also find out about Pensoft’s role as an active consortium member in the COAST-SCAPES, B-Cubed and Biodiversity Meets Data projects.   

Funded by the European Union’s Horizon Europe programme and coordinated by the Institute of Marine Sciences (ICM-CSIC), ANERIS brings together 25 partners from 13 countries. Over four years, the consortium has developed 11 technologies for marine life sensing and monitoring. They cover AI-assisted imaging of plankton and macrofauna, genomic and eDNA approaches and citizen science observatories such as MINKA.

As the project nears its end in December 2026, the focus is on making these tools usable beyond the project’s lifetime. This includes integrating them into European research infrastructures, which is why conversations with the EGI community were especially valuable. Combining large-scale imaging data, AI-based identification and citizen observations requires reliable storage, compute and data services. These are exactly the services EGI2026 participants build and operate.

The project’s results will be further showcased at the ANERIS Final Workshop “The future of marine monitoring – imaging, AI, and research infrastructures” on the 16th of November 2026. The hybrid event will be hosted by VLIZ in Oostende, Belgium. Through real-world case studies, partners will present tools including AI-driven underwater image restoration, automated organism identification platforms and integrated citizen science observatories. Shortly after, ANERIS will also take part in the 7th World Conference on Marine Biodiversity in Bruges.

The full plenary recordings and the detailed programme are available on the conference’s official website. 

Can We Teach AI to See the World the Way Animals Do?

New paper proposes using deep learning to collect richer ecological data, with the aim of better predicting how ecological communities change.

For decades, ecology has been very good at explaining the past. We can look at a collapsed fishery, a vanished pollinator population, or a coral reef bleaching event and piece together, after the fact, what went wrong. What ecology has struggled to do, and what it needs to get better at, is predicting these changes before they happen.

Conservation policymakers don’t just need to understand why an ecosystem collapsed last year. They need to know what will happen if we build a road through a forest, dam a river, or let a new pesticide into widespread use, before those decisions are made, not after the damage is done.

A new method paper by C. J. M. Musters and Geert R. de Snoo of Leiden University, published in Individual-based Ecology, explores whether combining deep learning with this individual-based framework could offer a way forward. They propose: closing the prediction gap requires not just better data, but an entirely different kind of data – and possibly, machines that sense the world the way animals do. 

Why Predicting Ecosystems Is So Hard

Ecological communities are dazzlingly complex. Every organism in a habitat is constantly responding to its environment and to every other organism around it, like competing for food, avoiding predators, seeking mates, adjusting behavior with the seasons. Traditional ecology often simplifies this complexity by grouping organisms into species-level categories. 

Ecosystem illustration
Example of an ecosystem. Credit to goodstudio via Canva.

Musters and de Snoo point to the work of ecologist John Lawton, who argued that this kind of unpredictability is strongest at “intermediate” scales – not in small populations of a single species, not across whole biomes, but somewhere in between. The authors define this middle ground as spaces of roughly 1 to 1,000,000 km² over 10 to 100 years. Unhelpfully, that’s also roughly the scale at which conservation decisions actually get made. 

Organism-based Ecology or Individual-based Ecology takes a different starting point. Instead of assuming species behave as uniform units, it treats individual organisms as the fundamental actors whose actions and interactions generate the patterns we see in ecosystems. That’s a more realistic picture – but also a far more complicated one. Communities become vast networks of individual organisms, each constantly gathering and responding to information from their surroundings and from each other. 

Where Deep Learning Comes In 

 Binary code
Binary codes. Credit to RDGraphics via Canva.

Deep learning (DL), the technology behind everything from image recognition to language models, is extraordinarily good at finding patterns in complex data. In principle, DL combined with organism-based ecology, the study of how individual organisms behave and interact, could be used to build models that predict how a community will shift as conditions change.

However, deep learning is only as good as the data you feed it, and the data ecology currently collects wasn’t designed with this goal in mind.

Traditional ecological datasets tend to record outcomes: population counts, species distributions, migration patterns. What they largely fail to capture is something more fundamental – the raw sensory information that organisms actually use to make decisions. A bird doesn’t respond to “average temperature over the season.” It responds to what it can see, smell, hear, and feel, moment to moment, in its environment.

Schematic
Flow diagram of the first three time-steps of a Recurrent Neural Network to predict changes in the state of community.  Credit to Musters & de Snoo GR, 2026.

If deep learning models are going to predict how organisms actually behave and interact, the authors argue, they need training data that reflects what the organisms themselves are sensing rather than just retrospective statistics ecologists usually collect. 

Building “Artificial Sense Organs” for Ecology

To generate that new kind of data, Musters and de Snoo propose building sensory instruments that mimic the sense organs of the organisms themselves – broad-spectrum devices that continuously and non-invasively record the same signals animals, plants, fungi, and microbes use to make decisions. Paired with existing tools like camera traps, biologging, satellite imagery, and environmental DNA sampling, this could generate the rich, organism-centered datasets that deep learning models actually need. 

A Call for Caution

Deep Learning models are black boxes, even when their predictions are accurate, it’s often unclear why. Models trained on incomplete or biased data can generate ecologically impossible results, like population sizes that go negative. 

Also, models trained largely on data from wealthy, well-studied regions could embed cultural assumptions that don’t transfer elsewhere. The authors offer a vivid example, Black-tailed Godwits are cherished in the Netherlands but considered agricultural pests in parts of West Africa, where they feed on rice rather than soil invertebrates. Applying a European-trained model globally, without care, risks a kind of “unintentional colonialism” in conservation decision-making. 

In their method paper, the authors are clear, that the models they describe don’t exist yet, and that building them will require new instruments, new interdisciplinary collaboration between ecologists and ethologists, and  critically explicit, published testing of where these models work and where they don’t. What they’re offering instead is a roadmap, by starting small, building sensory prototypes, training experimental models on well-studied plots, and rigorously checking every prediction against reality before trusting it with real conservation decisions. 

Whether “artificial sense organs” turn out to be the right way to get there remains to be seen. But the underlying challenge – teaching machines to understand ecosystems well enough to predict their future – is one of the more important questions facing conservation science today. 

Original source:

Musters CJM, de Snoo GR (2026) Challenges and opportunities for Artificial Intelligence for predicting changes in ecological communities. Individual-based Ecology 2: e199762. https://doi.org/10.3897/ibe.2.199762 

GBIF Marks 25 Years of FAIR Biodiversity Data, Now Spanning 70 Countries and 3.8 Billion Records

As GBIF marks 25 years and 3.8 billion records across 70 countries, a new overview looks ahead – tackling data gaps to shape the next quarter-century.

Digital biodiversity data has come a long way. Twenty-five years ago, the Global Biodiversity Information Facility (GBIF) launched with 21 founding countries and a simple but ambitious goal: make the world’s biodiversity data freely and openly available to anyone, anywhere.

Today, GBIF’s network includes 70 participating countries, along with data providers across more than 120 countries, offering open access to over 3.8 billion biodiversity data records. This milestone is explored in a new overview article published in the Biodiversity Data Journal, which traces GBIF’s trajectory over the past quarter-century and the challenges that remain as it looks ahead.

GBIF Executive Secretary Dr. Joe Miller remarked:

As GBIF celebrates its 25th anniversary, I’m very proud to serve as Executive Secretary of the organisation and to have contributed to this milestone publication. Detailing the history of GBIF both as an infrastructure and a global network, the article pays tribute to all the people involved in the network throughout a quarter century—be they staff, participants, nodes, volunteers, data publishers or data users. It represents the past, present and future of GBIF. I believe the paper will help strengthen our network and its capacity to respond to biodiversity data needs both now and in the future.

GBIF was established in 2001, following a proposal from the Organisation for Economic Cooperation and Development’s Megascience Forum which concluded that “an international mechanism is needed to make biodiversity data and information accessible worldwide”.

The call came in response to a problem facing the international community after the 1992 Rio Earth Summit: the world’s biodiversity knowledge was scattered across a small number of institutions, concentrated in wealthy countries, with no shared way to bring it together in support of the newly signed Convention on Biological Diversity.

Now, a quarter-century later, GBIF has become the foundational infrastructure for biodiversity science and policy worldwide.

A Growing Global Network

Biodiversity data in GBIF
Annual biodiversity data made available through the Global Biodiversity Information Facility as of July 2026. Credit to GBIF.

GBIF’s work is carried out through a distributed network of 47 voting country participants and 42 organisational participants, each represented by a national or thematic “node” that mobilises data, builds local capacity, and connects biodiversity communities to GBIF’s infrastructure. More than 2,700 institutions, including museums, universities, government agencies, citizen science platforms, and a growing number of private-sector organisations, have published data through the network, with new publishers joining at a rate of more than two every three days, totalling nearly 3500 organisations involved.

key numerical metrics of the Global Biodiversity Information Facility
Infographic summary of key numerical metrics of the Global Biodiversity Information Facility as of August 2026. See dynamic metrics at GBIF.org and at https://www.gbif.org/analytics/global.

The Biodiversity Data Journal itself is one example of this network in action, as it operates its own GBIF-hosted data portal – one of more than 20 such portals across Pensoft-published journals – providing direct access to hundreds of datasets and hundreds of thousands of occurrence records drawn from the journal’s publications.

Data Supporting Science and Policy

GBIF data mediation
The universe of GBIF data mediation.

GBIF-mediated data now underpin an average of eight new peer-reviewed research papers per day, and have contributed to more than 15,000 publications to date, spanning fields from climate change and food security to public health and invasive species management. An independent 2023 assessment estimated that GBIF generates roughly €12 in societal benefit for every €1 invested, with researcher time savings alone valued at €35 million annually.

The organisation’s impact also extends deeply into international policy. GBIF-mediated data support multiple indicators under the Kunming-Montreal Global Biodiversity Framework, inform assessments by the International Union for Conservation of Nature (IUCN) and the Intergovernmental Science-Policy Platform on Biodiversity and Ecosystem Services (IPBES), and are increasingly used by the private sector to meet emerging nature-related disclosure requirements.

Adapting to New Kinds of Data

Over 25 years, GBIF has continually expanded to accommodate new sources of biodiversity data – from digitised natural history specimens and citizen science observations to DNA-based records and, most recently, structured survey and monitoring data designed to support large-scale biodiversity tracking. In 2026, GBIF adopted the Catalogue of Life as its taxonomic backbone, the result of a multi-year collaboration to build shared infrastructure for reconciling species names across datasets.

Persistent Gaps Remain

key events of GBIF

A timeline of key events in the history of the Global Biodiversity Information Facility. Credit to Miller et al., 2026.

Despite this growth, GBIF recognises that several significant challenges remain. The global loss of biodiversity continues to be described as a crisis in major international assessments, even as the data infrastructure has improved. And the data itself continues to reflect long-standing imbalances – regions with high biodiversity, particularly in the Global South, remain underrepresented, while well-studied, charismatic groups such as birds are overrepresented compared to less visible taxa; furthermore, many marine species and hard-to-identify cryptic habitats and organisms remain inadequately documented.

Closing these gaps was part of the original motivation for creating GBIF a quarter-century ago, and it remains valid today. GBIF’s own assessment is that the network cannot resolve these asymmetries alone, doing so will depend on broader shifts in global scientific funding, data culture, and capacity, alongside GBIF’s continued efforts to expand its Participant network and to diversify the types of data it can mobilise.

An additional, ongoing challenge is data heterogeneity and data quality, because GBIF indexes data, rather than directly vetting every record, it relies on its network of data publishers to maintain quality at source, and on users to report issues – a distributed model that keeps the network scalable but is not without friction.

Looking Ahead

capacity development at GBIF.
Capacity development across the Global Biodiversity Information Facility community.  Credit to Miller et al., 2026.

Guided by its 2023–2027 Strategic Framework, GBIF is prioritising continued growth of its Participant network, expanded support for survey and monitoring data, and deeper integration of DNA-derived biodiversity records – all aimed at closing longstanding geographic and taxonomic gaps in digital biodiversity data worldwide.

Original source:

Miller J, Mandeville C, Schigel D, Gamboa Martinez J, Nielsen AM, Sheldon S, Hahn A, Raymond M, Bundgaard-Jensen S, Bagard Laursen M, Copas K, Blissett M, Høfft M, Méndez Hernández F, Noesgaard D, Rodrigues A, Russell L, Stjernegaard Jeppesen T, Elkjær Ørum-Kristensen A, Grosjean M, Waller J, Podolskiy M, Goodson H, Novakovikj S, Frøslev T, Ingenloff K, Sørensen Nilsson A, Svenningsen C, van der Meijden D, Suen A, Hakan Uzun A, Vaskova M, Nielsen C, Marentes Herrera E, Schaldemose Reibke N, Robertson T (2026) The Global Biodiversity Information Facility at 25. Biodiversity Data Journal 14: e208528. https://doi.org/10.3897/BDJ.14.e208528

How open science and shared data can help tackle global challenges: The Crete Declaration

European research infrastructures commit to advancing FAIR data integration and informing policy-making through integrated scientific knowledge.

The global community is facing a number of urgent challenges, such as emerging diseases, epidemics, antimicrobial resistance, food safety, water scarcity, environmental contamination, and severe changes in biodiversity. All of them are intensified by the widespread impact of climate change. These interconnected threats demand “a fundamental shift towards systemic, integrated solutions,” a systemic change of perspective in risk management, and a long-term, action-focused strategic vision, point out representatives of Europe’s leading biodiversity, ecology and engineering communities, coordinated by the LifeWatch European Research Infrastructure Consortium (ERIC). 

Text on a clean background asks how open science and shared data can address global challenges, introducing the Crete Declaration.

Together, the partners offer a unified, systemic response to these critical challenges. In the Crete Declaration, published in a policy brief in the open-science journal Research Ideas and Outcomes, they outline how scientific cooperation can be transformed into actionable policy and robust innovation.

Recognising the “intimate and inseparable link between the health of people, animals and plants and how they interact within ecosystems,” the signatories aim to significantly strengthen Europe’s resilience and global leadership by sharing data and expertise, developing innovative solutions, and promoting evidence-based policies.

Text highlighting the Crete Declaration, emphasizing collaboration in One Health approach among European research infrastructures. Background of mountains.

They argue that research infrastructures across Europe are uniquely positioned to provide solutions “that are firmly grounded in robust science and evidence-based insights into the functioning of our living environment.”

A key message the team would like to get across is that “[p]olicies anchored in reliable data are robust and, when rooted in societal participation, they will become more feasible, impactful and widely adopted.”

In addition, research infrastructures can provide unified data and service integration through collaboration and co-creation with users and stakeholders. To this end, it is essential to embrace and support open science as a driver for scientific and social innovation.

Text outlining the aims of signatories to address One Health challenges through research, innovation, and responsible use of AI.

To realise this vision, the parties commit to strengthening strategic collaboration. Another critical commitment is to advance data integration and FAIR Principles for open science by ensuring equitable access to data resources, software, workflows, standards, and protocols across domains.

To support open innovation in critical areas such as conservation, sustainable food systems, and water security, the signatories will establish a “trusted, inclusive platform for stakeholder engagement.”

Finally, they commit to providing integrated scientific knowledge to inform the policy and public, supporting effective, evidence-based policy-making and engaging citizens.

The Declaration was developed during a special assembly held in Crete in June 2025, hosted by the Institute of Marine Biology, Biotechnology and Aquaculture at the Hellenic Centre for Marine Research.

Text inviting European stakeholders to endorse a coordinated approach to One Health research and innovation.

The policy brief containing the Crete Declaration is the latest contribution to the LifeWatch ERIC Strategic Working Plan Outcomes open-science collection in the Research Ideas and Outcomes journal, a one-stop access point to the most important deliverables by the research infrastructure consortium.

Original source:

Arvanitidis C, Ameixa O, Basset A, Chatzinikolaou E, Coman C, Companys B, De Leo F, Deneudt K, Drago F, Eriksson J, Ferrari T, Georgiev T, Giuliano G, Gruber S, Habermann J, Heil K, Hubbard T, Huertas Olivares C, Kotoulas G, Koureas D, Manola N, Marrocco V, Pade N, Portugal Melo A, Provenzale A, Psomopoulos F, Raes N, Robinson S, Ruch P, Schaap D, Stanica A, Stavropoulos T, Teixeira H, van Tienderen P, Tsigenopoulos C, Waterhouse R, Aprea G, Boër M, Casino A, Delauney L, Ewbank J, Mirtl M, Pavlic-Zupanc J, Penev L, Piera J, Pitta P, Puillat I, Richter D, Stepanyan D, Ussi A, Węsławski J, Zuquim G (2025) The Crete Declaration: Uniting Science for One Health. Research Ideas and Outcomes 11: e176120. https://doi.org/10.3897/rio.11.e176120

Ensuring drug safety using AI models for adverse drug reaction prediction

An AI model developed to predict adverse drug reactions could potentially support early-stage drug safety assessment before clinical trials.

Adverse drug reactions (ADRs) are a significant cause of hospital admissions and treatment discontinuation worldwide. Conventional approaches often fail to detect rare or delayed effects of medicinal products. In order to improve early detection, a research team from the Medical University of Sofia developed a deep learning model to predict the likelihood of ADRs based solely on a drug’s chemical structure.

The model was built using a neural network trained using reference pharmacovigilance data. Input features were derived from SMILES codes – a standard format representing molecular structure. Predictions were generated for six major ADRs: hepatotoxicity, nephrotoxicity, cardiotoxicity, neurotoxicity, hypertension, and photosensitivity.

A flowchart illustrating chemical transformation, featuring molecular structures, fragment analysis, and decomposition stages.
Visual representation of SMILES and the process of molecular deconstruction. Adapted from Wu JN, Wang T, Chen Y, Tang LJ, Wu HL, Yu RQ. t-SMILES: a fragment-based molecular representation framework for de novo ligand design. Nat Commun. 2024 Jun 11;15(1): 4993. https://doi.org/10.1038/s41467-024-49388-6.

“We could conclude that it successfully identified many expected reactions while producing relatively few false positives,” the researchers write in their paper published in the journal Pharmacia, concluding it “demonstrates acceptable accuracy in predicting ADRs.”

Infographic detailing an AI model predicting adverse drug reactions for various compounds.

Testing of the model with well-characterized drugs resulted in predictions consistent with known side-effect profiles. For example, it estimated a 94.06% probability of hepatotoxicity for erythromycin, 88.44% for nephrotoxicity and 75.8% for hypertension in cisplatin. Additionally, 22% photosensitivity was predicted for cisplatin, while 64.8% photosensitivity was estimated for the experimental compound ezeprogind. For enadoline, a novel molecule, the model returned low probability scores across all ADRs, suggesting minimal risk.

Notably, these results demonstrate the model’s potential as a decision-support tool in early-phase drug discovery and regulatory safety monitoring. The authors acknowledge that performance of the infrastructure could be further enhanced by incorporating factors such as dose levels and patient-specific parameters.

Research article:

Ruseva V, Dobrev S, Getova-Kolarova V, Peneva A, Getov I, Dimitrova M, Petkova V (2025) In situ development of an artificial intelligence (AI) model for early detection of adverse drug reactions (ADRs) to ensure drug safety. Pharmacia 72: 1–8. https://doi.org/10.3897/pharmacia.72.e160997

Mining nature’s knowledge: turning text into data

By using natural language processing, researchers created a reliable system that can automatically read and pull useful data from thousands of articles.

Guest blog post by Joseph Cornelius, Harald Detering, Oscar Lithgow-Serrano, Donat Agosti, Fabio Rinaldi, and Robert M Waterhouse

In a groundbreaking new study, scientists are using powerful computer tools to gather key information about arthropods—creatures like insects, spiders, and crustaceans—from the large and growing collection of scientific papers. The research focuses on finding details in published texts about how these animals live and interact with their environment. By using natural language processing (a type of artificial intelligence that helps computers understand human language), the team created a reliable system that can automatically read and pull useful data from thousands of articles. This innovative method not only helps us learn more about the variety of life on Earth, but also supports efforts to solve environmental challenges by making it easier to access important biological information.

Illustration depicting species literature feeding data on arthropod traits into a database, linking researchers and the community.
Mining the literature to identify species, their traits, and associated values.

The challenge

Scientific literature contains vast amounts of essential data about species—like what arthropods eat, where they live, and how big they are. However, this information is often trapped in hard-to-access files and old publications, making large-scale analysis almost impossible. So how can we convert these pages into usable data?

The goal

The team set out to develop an automatic text‑mining system using Natural Language Processing (NLP) and machine learning to scan thousands of biology papers and extract structured information about insects and other arthropods to build a database linking species names with traits like “leg length” or “forest habitat” or “predator”.

How it works in practice

  1. Collect curated vocabularies of terms to be searched for in the texts:
  • ~1 million species names from the Catalogue of Life
  • 390 traits, categorised into feeding ecology, habitat, and morphology 
  1. Create “Gold‑standard” data needed to train language models:
  • Experts manually annotated 25 papers—labelling species, traits, values, and their links—to use as a training benchmark
  1. Train NLP models so they “learn” which are the terms of interest:
  • Named‑Entity Recognition using BioBERT for identifying species, trait, and value words or phrases in the texts
  • Relation Extraction using LUKE to link the words/phrases e.g. “this species has this trait” and “this trait has this value” 
  1. Automated extraction of words/phrases and their links:
  • Processed 2,000 open‑access papers from PubMed Central
  • Identified ~656,000 entities (species, traits, values) and ~339,000 links between them 
  1. Publish results in an open searchable online resource:
  • Developed ArTraDB, an interactive web database where users can search, view, and visualise species‑trait pairs and full species‑trait‑value triples
Text-mining is a conceptually and computationally challenging task.

What is needed for the next steps

  • Annotation complexity: Even experts struggled to agree on boundaries and precise relationships, underscoring the need for clearer guidelines and more training examples to improve the performance of the models
  • Gaps in the vocabularies of terms: Many were unrecognised due to missing synonyms, outdated species names, and variations in phrasing. Expanding vocabularies will help improve the ability to find the species, traits, and values
  • Community curation: Planned features in ArTraDB will allow scientists and citizen curators to improve annotations, helping retrain and refine the models over time

How it impacts science

  • Speeds up research: Scientists can find species‑trait data quickly and accurately, boosting studies in ecology, evolution, and biodiversity
  • Scale and scope: This semi‑automated method can eventually be extended well beyond arthropods to other species
  • Supports global biodiversity efforts: Enables creation of large, quantitative trait datasets essential for monitoring ecosystem changes, climate impact, and conservation strategies
Illustration of a butterfly with icons and arrows outlining key biological data: barcode, genome, distribution, nutrition, habitat, and more.
A long-term vision to connect species with knowledge about their biology.

The outcomes

This innovative work demonstrates how combining text mining, expert curation, and interactive databases can unlock centuries of biological research. It lays a scalable foundation for building robust, open-access trait databases—empowering both scientists and the public to explore the living world in unprecedented ways.

Research article:

Cornelius J, Detering H, Lithgow-Serrano O, Agosti D, Rinaldi F, Waterhouse R (2025) From literature to biodiversity data: mining arthropod organismal traits with machine learning. Biodiversity Data Journal 13: e153070. https://doi.org/10.3897/BDJ.13.e153070

Entangled “her”stories – How to create an open multi-linked dynamic dataset of plant genera named for women

Which plant genera do you know that are named for women? Who were/are they?

Guest blog post by  Siobhan Leachman, Sabine von Mering, Heather Lindon & Carmen Ulloa Ulloa

How it all began

A post on social media asked about plant genera named for women and sparked a lively discussion with many contributors. This simple question was not as easily answered as initially thought. The resulting informal working group tackled this topic remotely during the COVID-19 pandemic and beyond. The team was motivated by the desire to amplify the contribution of women to botany through eponymy. The work of this team has so far resulted in a paper in Biodiversity Data Journal, presentations at several conferences, and a linked open dataset.

Prior to our international collaboration, no dataset was available to answer these simple questions and the required information was scattered in many different data sources. We set out to bring these data together and in doing so developed and refined our workflow. Our data paper documents this innovative workflow bringing together the various data elements needed to answer our research questions. Ultimately we created a Linked Open Data (LOD) dataset that amplified the names of women and female mythological beings celebrated through generic names of flowering plants.

Linking the Data

During our research process we focused on pulling data from a wide variety of sources while at the same time proactively sharing the data generated as widely as possible. This was done by adding and linking it to multiple public databases and sources (push-pull) including the International Plant Name Index (hereafter IPNI), Tropicos®, Wikidata, Bionomia and the Biodiversity Heritage Library (hereafter BHL).

Visualisation of our workflow to create a working list of flowering plant genera named for women. 

For our list of genera, each of the protologues were reviewed to confirm the etymology or eponymy. To find the generic prologues, we searched botanical databases such as IPNI and Tropicos, openly accessible providers of digital publications and other digital libraries and websites that provide free access to such publications. Here the BHL was invaluable as the majority of protologues and many other relevant publications were openly accessible through this digital library. Where no digital publication was available we accessed scientific literature through our affiliated institutions.

For the women, our starting point was the “Index of Eponymic Plant Names – Extended Edition” by Lotte Burkhardt (2018). We manually extracted all genera honouring women.  This dataset was supplemented with other sources including IPNI (2023), Mari Mut (2017-2021), a 2022 updated version of Burkhardt’s document (Burkhardt 2022), as well as suggestions received from colleagues and generated from our own research.

We collected the following information as structured data: information on the woman honoured, the genera named in honour of the woman, the year and place of the protologue or original publication (the nomenclatural reference), the author(s) of the genus name, and the link to the protologue or original publication if available online.

Wikidata

Wikidata was the central data repository and linking mechanism for this project as it provided structured data that can be read and edited by humans and machines and it acts as a hub for other identifiers. As such Wikidata played a central role in semantic linking and enriching of our data.

Wikidata items for the plant genera were created or enriched with information about the name, the author(s) of the genus and the year of publication. Those statements were referenced using the original publication. If the protologue was available on BHL, the BHL bibliographic or page number was added to that reference, thus creating a digital link improving access to the protologue. While undertaking this work we also collated a list of all those public domain publications that appeared to be absent from BHL. We passed on this list to BHL and requested these texts be scanned and added to BHL for the benefit of everyone.

We then added a named after statement to the Wikidata item for the appropriate plant genera linking that item to the Wikidata item for the woman honoured. Wikidata items for the women honoured were newly created or enriched. We researched each person and her contributions, plus information on mythological figures where necessary, and added this information to Wikidata items. Our work also included disambiguating the woman from other people with identical or similar names. 

To amplify the women’s contributions to science and to enrich the wider (biodiversity) data ecosystem, we linked to other Wikidata items and websites or databases by adding other relevant identifiers. For example if the women were botanists, botanical collectors or other naturalists, we used the author property to link the women to publications written by them. In addition, we added the women to Bionomia and attributed specimens collected or identified by them to their profiles.

Our work also included enriching Wikidata items of taxon authors. IPNI and Tropicos were searched for these author names, and websites such as BHL, the Global Biodiversity Information Facility (GBIF) or other specialist databases were consulted. Corrections or newly researched information on taxon authors was placed not just in Wikidata but was also sent together with the corresponding references to IPNI and Tropicos. This information was then used by those organizations to update these databases accordingly. 

As a result of our data being placed in Wikidata it is available to be queried via the Wikidata Query Service.  

Our Goal Achieved

As a result of our project, we published a dataset of 728 genera honouring women or female beings. This was a nearly twenty-fold increase in the number of genera linked to women in Wikidata. Our analysis paper on this data is forthcoming.

Notable Women 

Monsonia L.

All of us came away from this research with a favourite story. One that stood out was Ann Monson, for whom Linnaeus named Monsonia. Linnaeus wrote a delightful letter to her about their creating, platonically of course, a kind of plant love-child between them, in the form of this new genus.

Translated from Latin : “….Lock these [seeds] in a pot, and place them in the window of the chamber towards the sun, when it bursts forth in February, and in the first summer the sun blooms and lasts the most beautiful Alstromeria, which no one has seen in England, and you bring forth no flowers. If it should come to pass, as I wish, if you offer our flames, I would only wish to beget with you an only child, as a pledge of my love, little Monsonia, by which you may perpetuate the fame of Lady in the kingdom of Flora, who was the Queen of Women.”

Fittonia Coem.

Two eponymous women with an interesting story are Sarah Mary Fitton and her sister Elizabeth. They wrote Conversations on Botany in 1817 accompanied by colour engravings of flowers which popularised botany with women. The genus Fittonia was named in their honour.

Chanekia Lundell

Another woman honoured in a plant genus was Mercedes Chanek, a Mayan plant collector who worked in the 1930’s for Cyrus Longworth Lundell and collected for the University of Michigan in British Honduras, today Belize. Very little is known about her life and work. However, her collections are detailed in Tropicos and Bionomia, and you can see the genus named for her by Lundell in IPNI under Chanekia.

Medusa Lour. and other genera

Medusa (c. 1597), by Caravaggio

An example of a mythological female being honoured in several plant names is that of Medusa, who has the most genera named after her, six, more than any real woman!

We hope that our data paper inspires others to use the methodology and workflow described to create other linked open datasets, e.g. celebrating and amplifying the contributions of underrepresented or marginalised groups in science.

Data paper: 

von Mering S, Gardiner LM, Knapp S, Lindon H, Leachman S, Ulloa Ulloa C, Vincent S, Vorontsova MS (2023) Creating a multi-linked dynamic dataset: a case study of plant genera named for women. Biodiversity Data Journal 11: e114408. https://doi.org/10.3897/BDJ.11.e114408

Maximising the impact of standardised biodiversity data: Pensoft’s role in the EU project B-Cubed

In line with its commitment to providing open-access biodiversity data, Pensoft has joined forces with 12 organisations to form the B-Cubed project.

The problem at hand

Measuring the extent and dynamics of the global biodiversity crisis is a challenging task that demands rapid, reliable and repeatable biodiversity monitoring data. Such data is essential for policymakers to be able to assess policy options effectively and accurately. To achieve this, however, there is a need to enhance the integration of biodiversity data from various sources, including citizen scientists, museums, herbaria, and researchers.

B-Cubed’s response

B-Cubed (Biodiversity Building Blocks for policy) hopes to tackle this challenge by reimagining the process of biodiversity monitoring, making it more adaptable and responsive. 

B-Cubed’s approach rests on six pillars: 

  • Improved alignment between policy and biodiversity data. Working closely with existing biodiversity initiatives to identify and meet policy needs.
  • Evidence base. Leveraging data cubes to standardise access to biodiversity data using the Essential Biodiversity Variables framework. These cubes are the basis for models and indicators of biodiversity.
  • Cloud computing environment. Providing users with access to the models in real-time and on demand.
  • Automated workflows. Developing exemplary automated workflows for modelling using biodiversity data cubes and for calculating change indicators.
  • Case studies. Demonstrating the effectiveness of B-Cubed’s tools.
  • Capacity building. Ensuring that the solutions meet openness standards and training end-users to employ them.

Pensoft’s role

Harnessing its experience in the communication, dissemination and exploitation of numerous EU projects, Pensoft focuses on maximising B-Cubed’s impact and ensuring the adoption and long-term legacy of its results. This encompasses a wide array of activities, ranging all the way from building the project’s visual and online presence to translating its results into policy recommendations. Pensoft also oversees B-Cubed’s data management by developing a Data Management Plan which ensures the implementation of the FAIR data principles and maximises the access to and re-use of the project’s research outputs.

Full list of partners

Visit B-Cubed’s website at https://b-cubed.eu/. You can also follow the project on X @BCubedProject and LinkedIn /B-Cubed Project, as well as by subscribing to its newsletter here.

Data checking for biodiversity collections and other biodiversity data compilers from Pensoft

Guest blog post by Dr Robert Mesibov

Proofreading the text of scientific papers isn’t hard, although it can be tedious. Are all the words spelled correctly? Is all the punctuation correct and in the right place? Is the writing clear and concise, with correct grammar? Are all the cited references listed in the References section, and vice-versa? Are the figure and table citations correct?

Proofreading of text is usually done first by the reviewers, and then finished by the editors and copy editors employed by scientific publishers. A similar kind of proofreading is also done with the small tables of data found in scientific papers, mainly by reviewers familiar with the management and analysis of the data concerned.

But what about proofreading the big volumes of data that are common in biodiversity informatics? Tables with tens or hundreds of thousands of rows and dozens of columns? Who does the proofreading?

Sadly, the answer is usually “No one”. Proofreading large amounts of data isn’t easy and requires special skills and digital tools. The people who compile biodiversity data often lack the skills, the software or the time to properly check what they’ve compiled.

The result is that a great deal of the data made available through biodiversity projects like GBIF is — to be charitable — “messy”. Biodiversity data often needs a lot of patient cleaning by end-users before it’s ready for analysis. To assist end-users, GBIF and other aggregators attach “flags” to each record in the database where an automated check has found a problem. These checks find the most obvious problems amongst the many possible data compilation errors. End-users often have much more work to do after the flags have been dealt with.

In 2017, Pensoft employed a data specialist to proofread the online datasets that are referenced in manuscripts submitted to Pensoft’s journals as data papers. The results of the data-checking are sent to the data paper’s authors, who then edit the datasets. This process has substantially improved many datasets (including those already made available through GBIF) and made them more suitable for digital re-use. At blog publication time, more than 200 datasets have been checked in this way.

Note that a Pensoft data audit does not check the accuracy of the data, for example, whether the authority for a species name is correct, or whether the latitude/longitude for a collecting locality agrees with the verbal description of that locality. For a more or less complete list of what does get checked, see the Data checklist at the bottom of this blog post. These checks are aimed at ensuring that datasets are correctly organised, consistently formatted and easy to move from one digital application to another. The next reader of a digital dataset is likely to be a computer program, not a human. It is essential that the data are structured and formatted, so that they are easily processed by that program and by other programs in the pipeline between the data compiler and the next human user of the data.

Pensoft’s data-checking workflow was previously offered only to authors of data paper manuscripts. It is now available to data compilers generally, with three levels of service:

  • Basic: the compiler gets a detailed report on what needs fixing
  • Standard: minor problems are fixed in the dataset and reported
  • Premium: all detected problems are fixed in collaboration with the data compiler and a report is provided

Because datasets vary so much in size and content, it is not possible to set a price in advance for basic, standard and premium data-checking. To get a quote for a dataset, send an email with a small sample of the data topublishing@pensoft.net.

—

Data checklist

Minor problems:

  • dataset not UTF-8 encoded
  • blank or broken records
  • characters other than letters, numbers, punctuation and plain whitespace
  • more than one version (the simplest or most correct one) for each character
  • unnecessary whitespace
  • Windows carriage returns (retained if required)
  • encoding errors (e.g. “Dum?ril” instead of “Duméril”)
  • missing data with a variety of representations (blank, “-“, “NA”, “?” etc)

Major problems:

  • unintended shifts of data items between fields
  • incorrect or inconsistent formatting of data items (e.g. dates)
  • different representations of the same data item (pseudo-duplication)
  • for Darwin Core datasets, incorrect use of Darwin Core fields
  • data items that are invalid or inappropriate for a field
  • data items that should be split between fields
  • data items referring to unexplained entities (e.g. “habitat is type A”)
  • truncated data items
  • disagreements between fields within a record
  • missing, but expected, data items
  • incorrectly associated data items (e.g. two country codes for the same country)
  • duplicate records, or partial duplicate records where not needed

For details of the methods used, see the author’s online resources:

***

Find more for Pensoft’s data audit workflow provided for data papers submitted to Pensoft journals on Pensoft’s blog.